
PERTH’S WILD WEATHER
So far, winter in Perth has felt freezing for most, and we’ve been battered and washed away with a series of storms throughout July and the beginning of August. So, being curious creatures here at Urbaqua, we wanted to investigate! Has this weather been out of the ordinary for Perth? It’s definitely felt a lot colder and wetter than usual.
As a start, we gathered temperature data from the Bureau of Meteorology (BOM) at the Perth Metro weather station to help us determine if the start of winter temperatures were colder than average. The data indicates that the end of June was particularly cold. Mean temperatures were in general 1.0 to 1.5 degrees colder than the average, and the mean June temperature was 12.9 degrees which is the coldest mean monthly June temperature in Perth for 26 years. Despite this, however, July has not been particularly cold when compared to historical averages. The average temperature in WA throughout July was 1.6 degrees warmer than the 1961-90 average, and was the third warmest July on record!
To help us determine if recent rainfall has been more intense than usual, we started with gathering available rainfall depth and half-hourly duration data from weather stations across Perth. This data was then compared to the ARR 2016 Intensity-Frequency-Duration (IFD) rainfall tables for each single-point location (weather station latitude and longitude) to determine the Annual Exceedance Probability (AEP) of storm events.
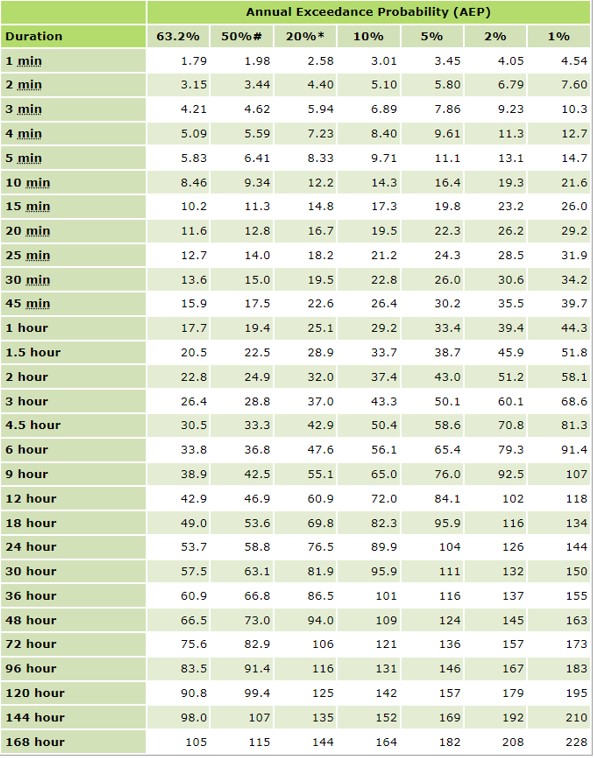
Source: BOM
It was found that rainfall events varied significantly across the chosen sites. Rainfall appeared to have fallen in a series of short bursts of variable intensity. Friday the 9th of July and Monday the 26th of July recorded the lowest AEP events at Perth Metro, Swanbourne and Jandakot Airport stations. (Low probability is generally associated with larger rainfall events.) The less frequent events have been presented in the table below, with Jandakot Aero recording the lowest AEP (likely to be the largest rainfall event) of the given dataset. All other days in July recorded relatively high AEP events (i.e. more frequent) above 63.2%, which is less than an average daily rainfall event. Jandakot Aero received 8.40 mm in 5 minutes, which is between a 20% and 10 % AEP short duration event (or a 1 in 5 year and 1 in 10 year event in the old language!). A 20% to 50% AEP event (between a 1 in 5 year and 1 in 2 year event) was also recorded on Monday the 26th.
Table 1: BOM Weather Station AEP events.
| Storm date | Perth Metro AEP % | Swanbourne AEP % | Jandakot Aero AEP % |
| Sunday 4th | Between 50% and 20% | Approx. 63.2% | Greater than 63.2% |
| Fri 9th | Approx. 20% AEP | Between 20% and 50% | Between 10% and 20% |
| Monday 26th | Between 50% and 20% | Between 20% and 50% | Between 20% and 50% |
5 minute rainfall data shared by the City of Joondalup indicates a peak event occurred on Friday the 9th at their Sorrento rain gauge, receiving 12mm in 10 minutes. This would make that event a 20% AEP event (or a 1 in 5 year event) for that location. Having access to rain gauge data to record detailed measurements can greatly enhance a within a Local Government’s understanding of rainfall within their region, and help to enable better engineered solutions and performance of drainage systems.
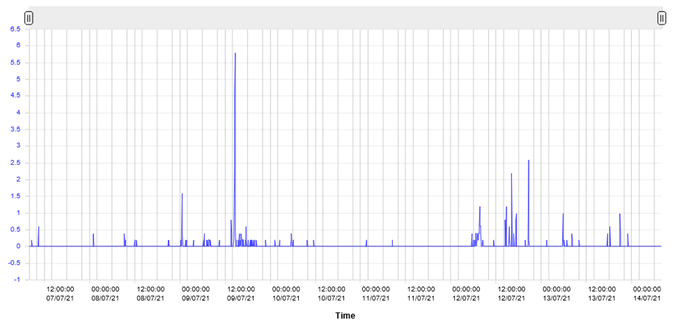
Source: Graham Withers at City of Joondalup
A large amount of rainfall which falls over a shorter duration can overload drainage systems and cause flooding. Solutions such as permeable paving may be an option to help spread out infiltration of rainfall at-source, and to reduce the amount of rainfall runoff and alleviate some stress on downstream drainage systems. The below photos display the difference between using permeable pavement, versus a traditionally constructed road. More information on permeable paving can be found here.
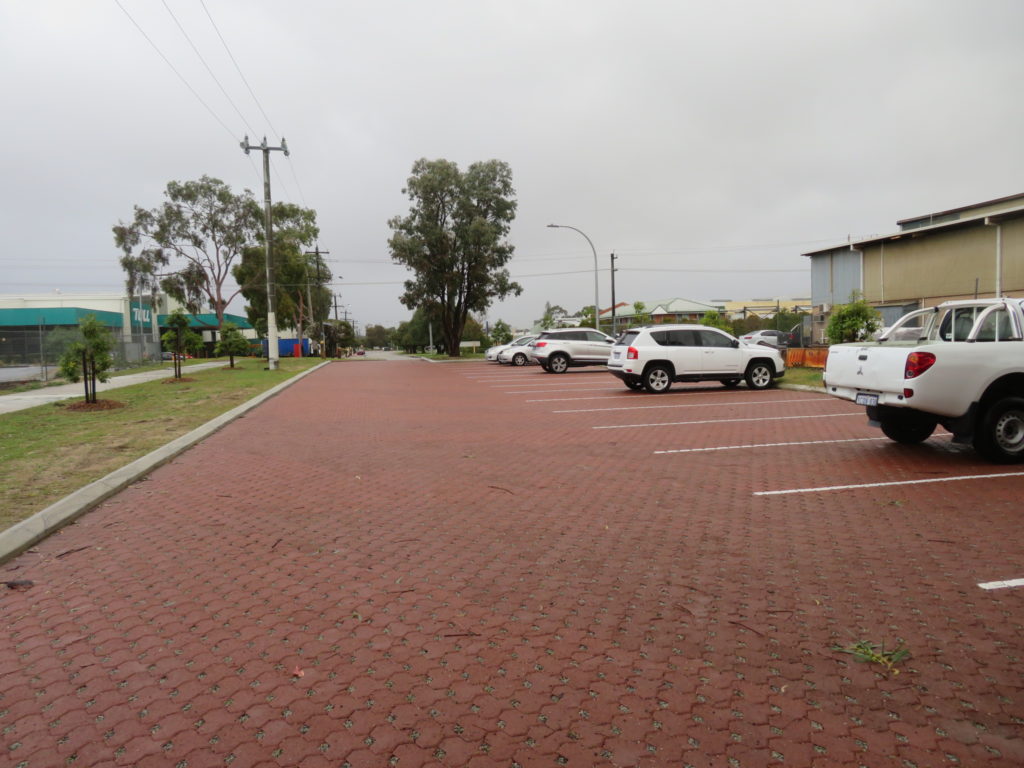
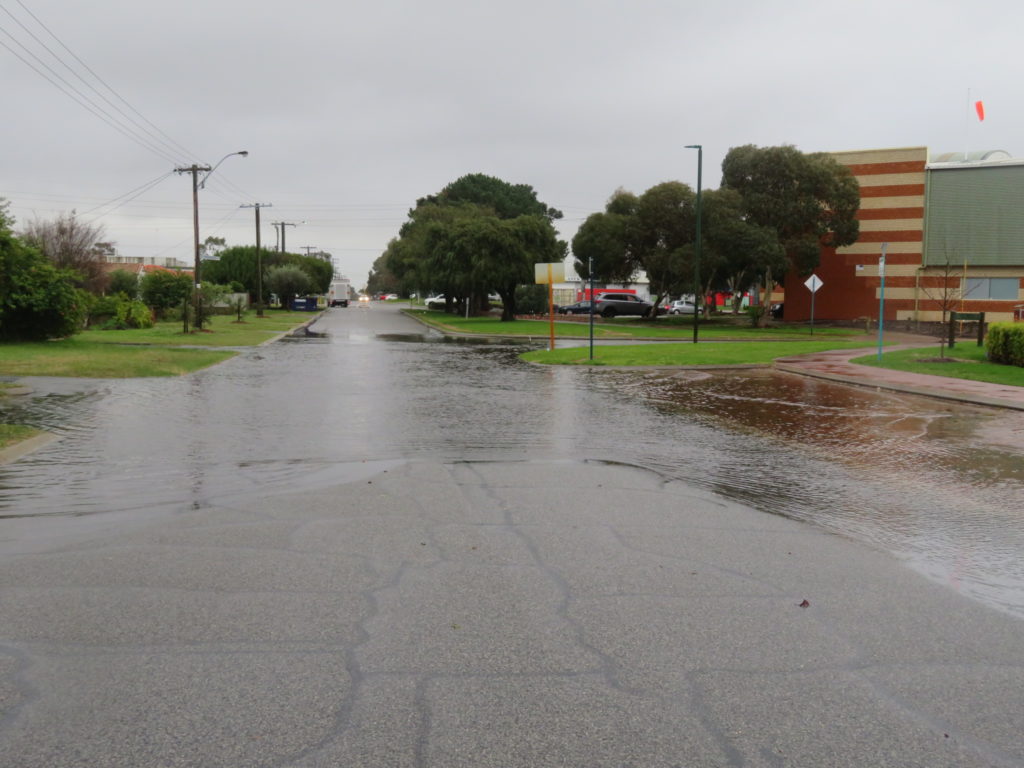
Source: Vic Bijl
Monthly Perth Metro rainfall data was also analysed to determine if this much rain was greater than typically recorded in July. The total rainfall received during July at the Perth Metro weather station was 271.4 mm and is the highest monthly July rainfall since 1995 (278.6 mm). This is 124.6 mm higher than the mean monthly total for July and is almost double the monthly average! Perth Metro recorded 44.6 mm of rainfall on July 4th alone, which is the wettest July day since 2001.
This month has been particularly wet, although long-term rainfall trends continue to reflect a drying climate despite outlier months such as this. Weather extremes are also expected to increase in severity as climate change progresses, as stated in the new IPCC Report: “Human-induced climate change is already affecting many weather and climate extremes in every region across the globe. Evidence of observed changes in extremes such as heatwaves, heavy precipitation, droughts, and tropical cyclones, and, in particular, their attribution to human influence, has strengthened since the Fifth Assessment Report”. Scary stuff.
So, what’s behind this recent crazy weather? BOM largely attributed these storms to multiple cold fronts crossing the WA coastline. A closer look into WA’s climate drivers indicates the Indian Ocean Dipole (IOD) is currently in a “negative event” phase. This means warmer than average sea surface temperatures are present near Indonesia, and cooler than average temperatures in the western Indian Ocean. This causes greater convection near Australia, and in general enhanced rainfall (although this is usually enhanced for northern and eastern Australia areas). Further information on Australian climate drivers and predictions can be found here.